How Much a Vet Visit Costs in Every US State
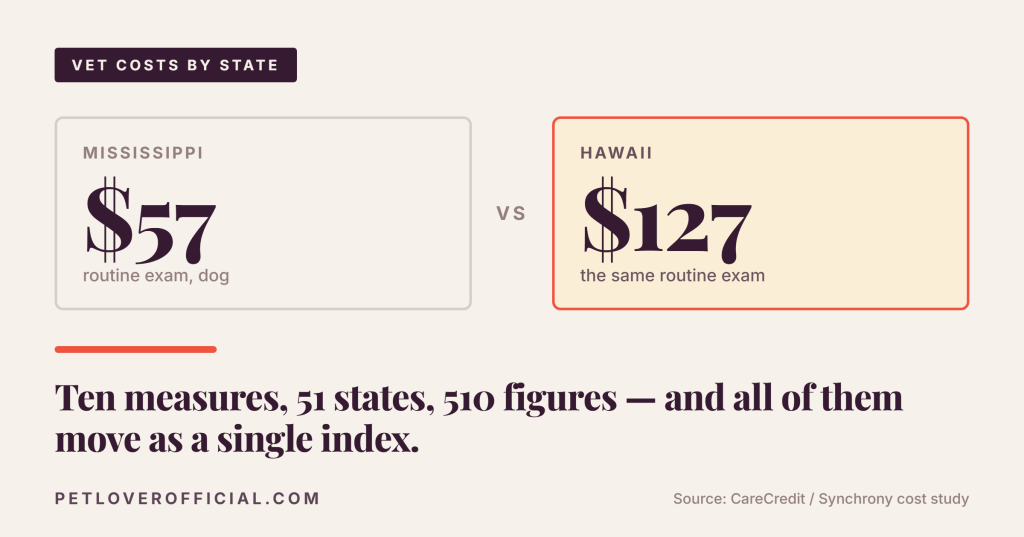
A routine exam runs $57 in Mississippi and $127 in Hawaii. A course of cancer therapy runs $4,220 and $9,387 in the same two states. Those are CareCredit’s published figures, and the full table is below — along with something we found by checking all 510 of them against each other, which changes how the whole table should be read.
The short answer. Where you live changes the price of veterinary care by a factor of about 2.2, and it changes everything by the same factor. We pulled every state-level figure CareCredit publishes — ten different measures, from a $57 office visit to a $9,387 cancer course, across all fifty states and DC — and each state’s ten numbers sit in the same ratio to one another, within about one percent. There is one geographic factor per state, applied to a national baseline for each procedure. That makes the table an excellent answer to “is my area expensive?” and a poor answer to “what will my clinic charge for this?”
Every state, most expensive to cheapest
The cost factor comes first — how far above the cheapest state a given state’s prices sit — followed by the five published figures. The six highlighted rows run at least 45% above the floor.
| State / District | Cost factor | Routine, dog | Routine, cat | ER, dog | ER, cat | Cancer, dog |
|---|---|---|---|---|---|---|
| Hawaii | 2.23× | $127 | $129 | $241 | $257 | $9,387 |
| Massachusetts | 1.74× | $99 | $101 | $188 | $200 | $7,335 |
| District of Columbia | 1.69× | $97 | $98 | $183 | $193 | $7,104 |
| California | 1.66× | $94 | $96 | $180 | $190 | $7,019 |
| Alaska | 1.48× | $84 | $86 | $160 | $171 | $6,240 |
| New York | 1.47× | $83 | $85 | $159 | $170 | $6,212 |
| Maryland | 1.38× | $79 | $80 | $150 | $159 | $5,838 |
| Vermont | 1.37× | $78 | $79 | $149 | $156 | $5,789 |
| Washington | 1.37× | $77 | $79 | $148 | $157 | $5,761 |
| New Jersey | 1.37× | $77 | $79 | $148 | $157 | $5,750 |
| Rhode Island | 1.34× | $76 | $78 | $146 | $154 | $5,673 |
| Connecticut | 1.34× | $76 | $78 | $146 | $153 | $5,657 |
| New Hampshire | 1.34× | $76 | $77 | $146 | $154 | $5,646 |
| Oregon | 1.33× | $75 | $77 | $144 | $153 | $5,624 |
| Maine | 1.30× | $74 | $75 | $142 | $149 | $5,497 |
| Arizona | 1.29× | $73 | $75 | $139 | $147 | $5,426 |
| Colorado | 1.26× | $72 | $73 | $137 | $145 | $5,343 |
| Utah | 1.24× | $70 | $72 | $134 | $142 | $5,227 |
| Montana | 1.23× | $70 | $71 | $135 | $142 | $5,205 |
| Florida | 1.23× | $70 | $71 | $133 | $141 | $5,176 |
| Delaware | 1.22× | $69 | $70 | $132 | $140 | $5,128 |
| Idaho | 1.22× | $69 | $71 | $132 | $140 | $5,117 |
| Nevada | 1.21× | $69 | $70 | $131 | $139 | $5,112 |
| Virginia | 1.21× | $69 | $70 | $131 | $137 | $5,090 |
| North Carolina | 1.17× | $66 | $67 | $127 | $134 | $4,936 |
| Wisconsin | 1.16× | $66 | $67 | $125 | $133 | $4,886 |
| South Carolina | 1.15× | $66 | $67 | $125 | $131 | $4,804 |
| Wyoming | 1.14× | $65 | $66 | $124 | $131 | $4,798 |
| Pennsylvania | 1.14× | $64 | $66 | $124 | $131 | $4,798 |
| Minnesota | 1.14× | $64 | $66 | $123 | $131 | $4,826 |
| Ohio | 1.13× | $64 | $65 | $122 | $130 | $4,760 |
| Illinois | 1.13× | $64 | $65 | $122 | $130 | $4,749 |
| Nebraska | 1.12× | $64 | $65 | $121 | $129 | $4,721 |
| New Mexico | 1.12× | $63 | $65 | $121 | $128 | $4,705 |
| Kentucky | 1.11× | $63 | $64 | $120 | $127 | $4,683 |
| South Dakota | 1.11× | $63 | $64 | $120 | $127 | $4,650 |
| Texas | 1.11× | $63 | $64 | $120 | $127 | $4,663 |
| Louisiana | 1.11× | $63 | $64 | $119 | $127 | $4,672 |
| North Dakota | 1.10× | $62 | $63 | $119 | $126 | $4,611 |
| Georgia | 1.09× | $62 | $63 | $118 | $125 | $4,617 |
| Tennessee | 1.08× | $62 | $63 | $117 | $124 | $4,551 |
| Michigan | 1.08× | $61 | $63 | $117 | $124 | $4,573 |
| Indiana | 1.08× | $62 | $63 | $117 | $124 | $4,567 |
| Iowa | 1.07× | $61 | $62 | $116 | $123 | $4,507 |
| Missouri | 1.06× | $60 | $61 | $115 | $122 | $4,468 |
| Alabama | 1.05× | $59 | $61 | $114 | $120 | $4,413 |
| Kansas | 1.03× | $58 | $60 | $113 | $119 | $4,347 |
| Arkansas | 1.03× | $58 | $60 | $112 | $119 | $4,364 |
| Oklahoma | 1.02× | $58 | $59 | $111 | $118 | $4,287 |
| West Virginia | 1.00× | $57 | $58 | $109 | $115 | $4,231 |
| Mississippi | 1.00× | $57 | $58 | $108 | $115 | $4,220 |
What the state column is actually measuring
CareCredit breaks ten different measures down by state across its cost pages: routine and emergency exams for dogs and cats, cancer therapy for dogs and cats, and MRI, ultrasound, spay and neuter for dogs. That is 510 published figures, spanning a $57 office visit to a $9,387 course of treatment.
If those came from independent price surveys, you would expect them to move independently. A state with a glut of emergency hospitals might be cheap for ER visits and ordinary for routine ones. A state with one teaching hospital and no private oncology might be average on exams and brutal on chemotherapy.
That is not what the data does. Take Hawaii, the most expensive jurisdiction, and divide each figure by the matching figure for Mississippi, the cheapest:
| Measure | Mississippi | Hawaii | Ratio |
|---|---|---|---|
| Routine exam, dog | $57 | $127 | 2.228 |
| Routine exam, cat | $58 | $129 | 2.224 |
| ER exam, dog | $108 | $241 | 2.231 |
| ER exam, cat | $115 | $257 | 2.235 |
| Cancer therapy, dog | $4,220 | $9,387 | 2.224 |
| MRI, dog | $1,828 | $4,072 | 2.228 |
A seventy-dollar office visit and a nine-thousand-dollar cancer course scale by the same number, to three decimal places. Across all ten measures the Hawaii-to-Mississippi ratio never leaves the range 2.21 to 2.25. We ran the check on every jurisdiction: each state’s ten implied ratios differ from their own average by 1.01% on average, and never by more than 1.63% — a spread fully explained by the figures being rounded to whole dollars. Independently measured prices across ten procedures and fifty-one markets do not behave like that.
The reading that fits is simple. There is one national baseline per procedure and one geographic factor per state. Multiply, round, publish. CareCredit’s footnote says only that “actual cost may vary based on geography, provider and other variables” and that the research covered all fifty states and DC. It does not claim each state was priced procedure by procedure, and the arithmetic says it was not.
This is not an accusation, and the table is not worthless. One cost-of-care index per state is a defensible way to present national survey data geographically, and it beats most of what gets published about vet prices. The problem is only in how the table gets used. Sites reprint these figures as surveyed local prices and readers treat them as quotes. They are a relative index. Read as one, they are genuinely useful.
What the index can and cannot tell you
It answers: is my area expensive?
This the index does well, and the uniformity is what makes it trustworthy here. If you live in Hawaii, Massachusetts, DC, California, Alaska or New York, care near you costs meaningfully more, and it will cost more across the board rather than only at the front desk.
It answers: roughly what will the exam cost?
Within reason. The index is a state-wide factor, and prices inside a state vary more than prices between states. A specialty hospital in downtown Chicago and a rural Illinois practice are both “Illinois.”
It does not answer: what will this surgery cost?
A state figure exists for cancer therapy, MRI, ultrasound, spay and neuter — but it is the national average wearing a local label, not a survey of surgeons near you. For anything above a few hundred dollars, the spread between two hospitals in one city will swamp the spread between two states.
It says nothing at all about the rest
Hospitalization, oxygen, wound repair, foreign-body surgery, cruciate repair: published as bare national averages with no state breakdown anywhere. Those are listed below, and they are the bills that empty a savings account.
The bills with no state figure at all
Everything in the table below exists only as a single national number. If you want to adjust one to where you live, the geographic factor is the only tool available — and it was never published for these.
| Procedure | Dogs | Cats |
|---|---|---|
| IV catheter and one bag of fluid | $130 | $121 |
| Wound treatment, puncture wound | $857 | $296 |
| Hospitalization, emergency clinic | $1,323 | $1,144 |
| Oxygen therapy, large dog | $1,861 | — |
| CCL / TPLO surgery, per knee | $3,525 | $3,453 |
| Emergency surgery, foreign body | $4,383 | $2,367 |
| Colon tumor surgery, with chemotherapy | $8,733 | — |
Put the two halves together and the shape of the problem is clear. The figures that come with a local label are an index. The figures that could cost you a car come with no label at all.
CoverageWhich of these does pet insurance pay for?
The split is cleaner than most owners expect.
Not covered
- Routine annual exams: never, on an accident-and-illness policy
- Vaccinations, fecal exams, parasite prevention: never
- Spay and neuter: never, as elective procedures
- Wellness add-ons cover these, but they are prepaid budgets priced to break even, not insurance
This is what you are insuring
- Emergency surgery, hospitalization, oxygen, wound repair: covered
- MRI and ultrasound as diagnostics for a covered condition: covered
- Cancer therapy: covered, and the single best argument for a high annual limit
- Cruciate repair: covered, but most insurers make you wait six months first
The practical consequence. If you live in a high-factor state your premium is already higher, because insurers rate by ZIP code too. What the factor should change is the annual limit you pick, not whether you buy at all. A $5,000 cap in Hawaii buys you roughly what a $2,200 cap buys in Mississippi — and in Hawaii a single cancer course averages $9,387, which exhausts a $5,000 cap a little past halfway. Our guide to how reimbursement works walks through the arithmetic on a real claim.
What owners ask next
My clinic charges more than my state’s figure. Is the table wrong?
Probably not wrong, just the wrong tool. The published figure is a national average scaled to your state. Urban practices, specialty hospitals and 24-hour emergency centers all sit above it, and in a state with one expensive metro area most of the population lives above the state average. Treat it as a floor for an ordinary general practice, not a quote.
Why are cats a few dollars more than dogs on exams but thousands less on cancer?
The exam gap is small and consistent — about 2% on routine visits and 6% on emergency ones, in every state, which is a property of the index rather than anything about cats. The treatment gap is real: cancer therapy averages $4,234 for cats against $5,211 for dogs, because drug dose and hospitalization scale with body weight. Insuring a cat costs about half what insuring a dog does for the same reason.
Does moving to a cheaper state actually save money?
On vet bills, yes, and in direct proportion — the same factor applies to the exam and to the cancer course. Your premium should fall too, since insurers rate by location. But for a healthy pet the saving is on a base of a few hundred dollars a year. It is not a reason to move, and it is not a reason to skip coverage in an expensive state; the expensive state is precisely where an uninsured five-figure year hurts most.
Is there a better source for local prices?
For the exam fee, your own clinic: most practices will quote a routine exam over the phone in under a minute, and that one number tells you more than any table. For surgery, ask for a written estimate covering the whole procedure including diagnostics, anesthesia and follow-up. We are not aware of any public dataset that prices veterinary surgery at state level from actual local quotes.
How current are these figures?
CareCredit attributes the routine-visit data to a 2025–2026 study and the emergency and chemotherapy data to 2025 studies, all conducted by ASQ360° Market Research. We read the pages on 1 October 2026. Veterinary prices have been rising faster than general inflation for several years, so treat anything here as a floor rather than a forecast.
Use it as an index, not as a price list
This is the most complete public picture of what veterinary care costs by state, and it is worth having. Find your state, read the factor, and you know whether you are in an expensive market — a conclusion the data supports strongly, because the same factor holds across all ten measures. That should push your annual coverage limit up or down.
What it will not do is tell you what Tuesday’s bill will be. Each state’s figures are one number wearing ten hats, and the procedures most likely to empty a savings account carry no state figure at all. If you want to know what your vet charges, the fastest primary source is still your vet.
Compare six pet insurersRelated guides
The Year’s Biggest Vet Bills
The twenty largest claims US insurers paid in 2025. Only three were injuries, half the animals were seven or younger, and the largest was $66,600 — none of which appears in any cost-by-state table.
Pet Insurance Laws by State
The other thing that changes when you cross a state line. Seventeen states regulate pet insurance and thirty-three do not, and in one of them the law makes you pay the vet before you can claim.
Dog Cancer Treatment Cost
The $5,254 national average broken into its parts: $700 to $2,000 to reach a diagnosis, then four to six months of treatment, then the rechecks nobody budgets for.
Daisuke
Daisuke writes about pet insurance and the cost of veterinary care for petloverofficial.com. He builds each cost guide from published studies and policy documents rather than marketing pages, checks the figures against each other before publishing them, and says plainly when a number is an estimate rather than a measurement.

